
A Thread Viewer plugin for Open Integration Engine is now available. It adds a dashboard tab showing live JVM thread activity, with each thread tied back to the channel and connector responsible for it. Courtesy of Chris Gibson.
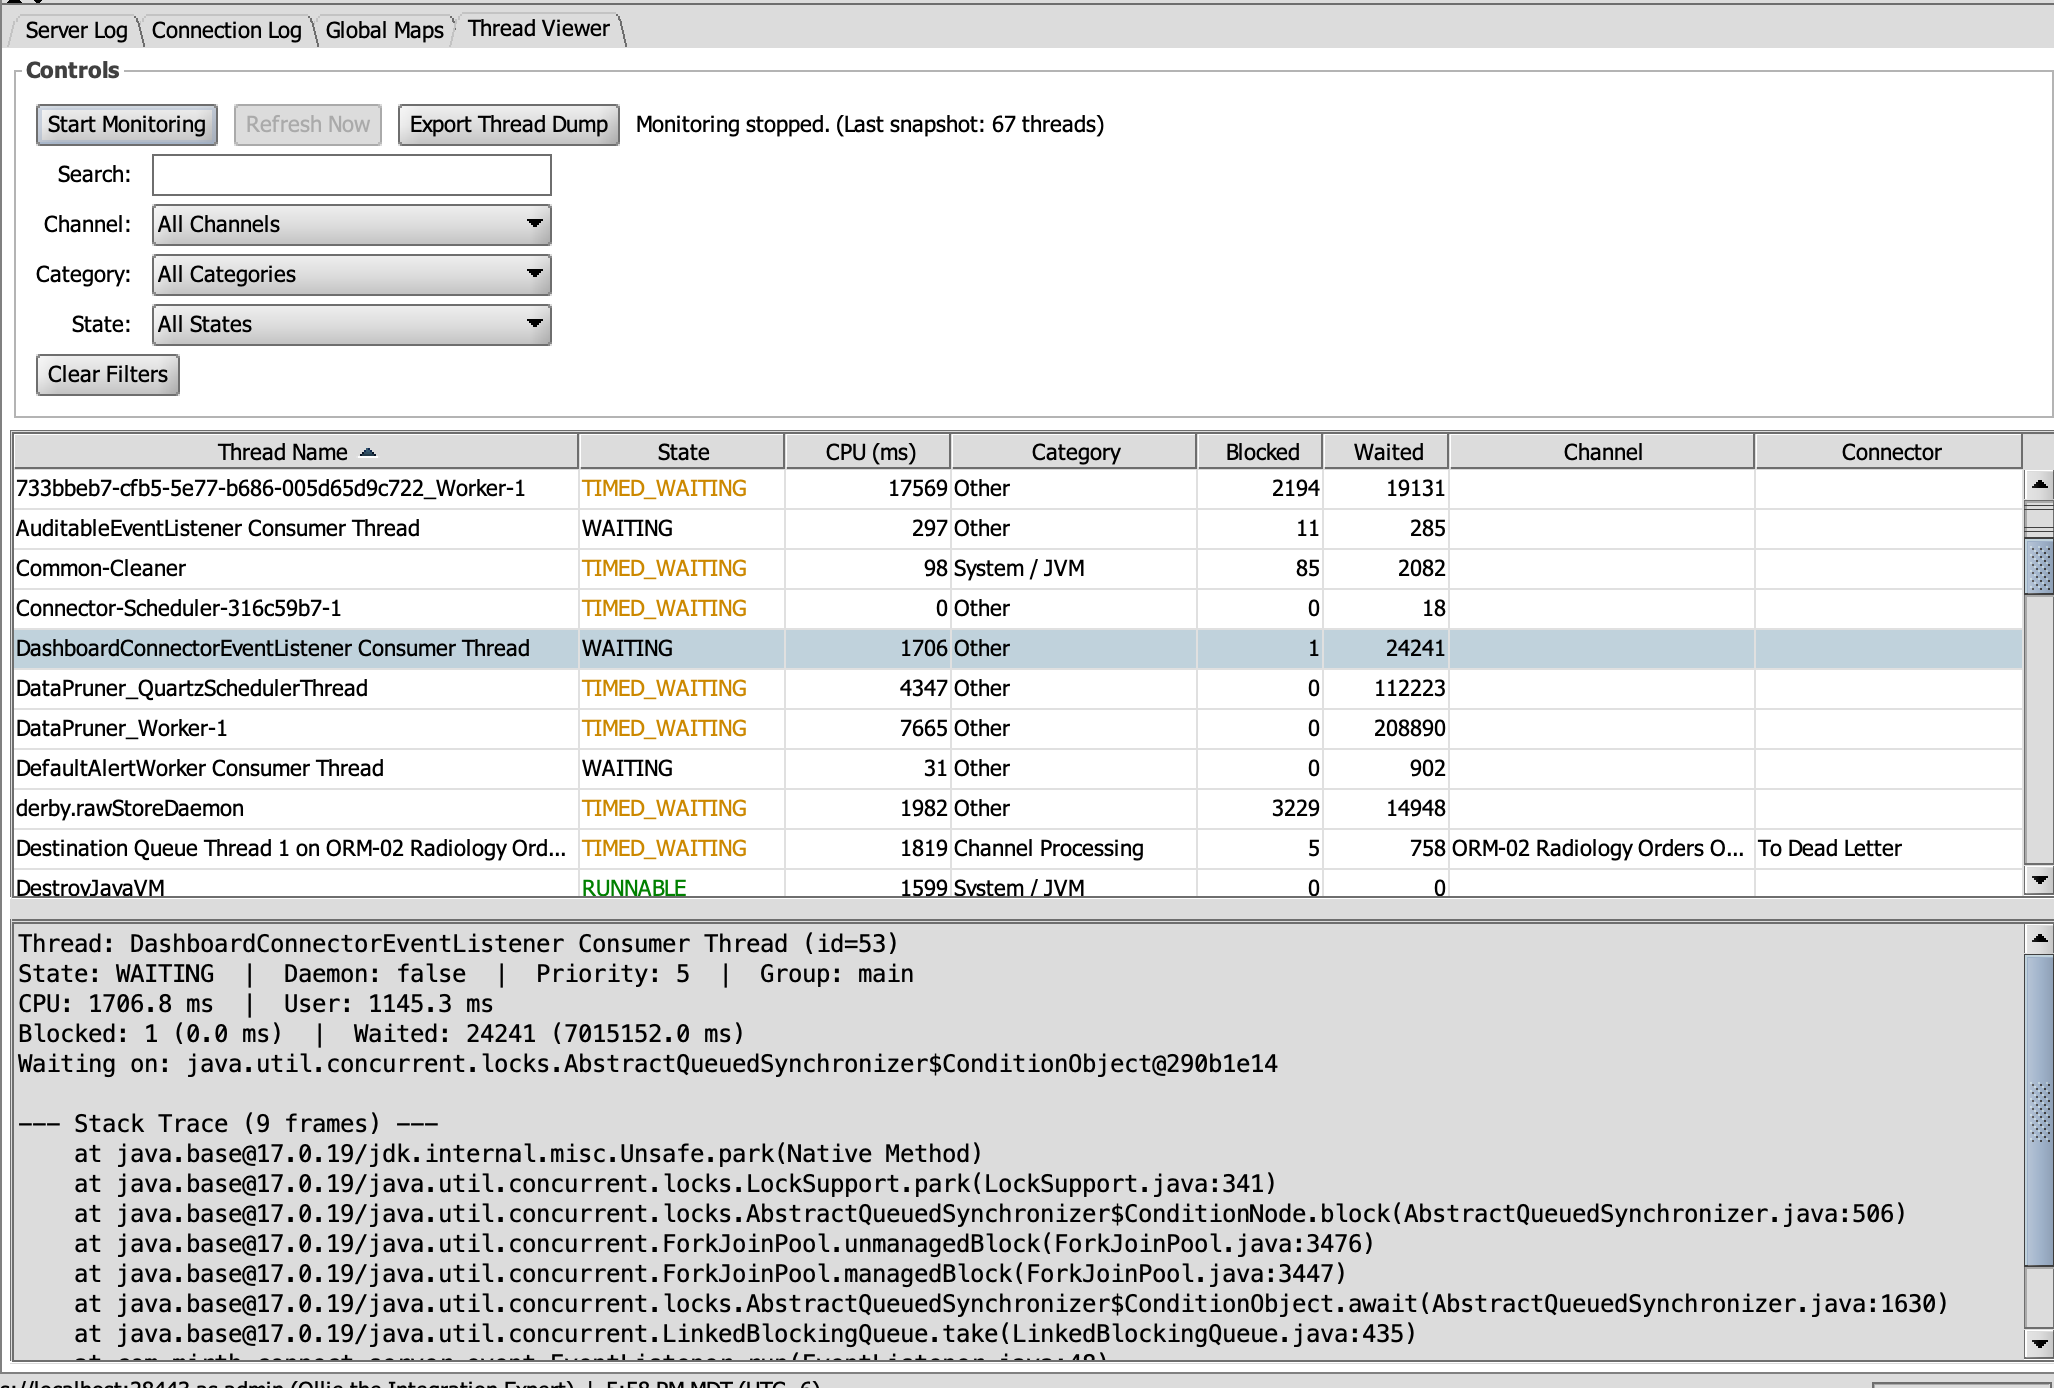
What it does: Shows every thread in the running engine with its state, CPU time, and blocked and waited counts, alongside the full stack trace for whichever thread is selected. Threads are classified by category and, where OIE’s thread naming allows it, correlated to the channel and connector they belong to. That turns “the engine is busy” into a specific channel.
Key features:
- Channel correlation – threads resolved to the channel and connector running them
- Category classification – Channel Processing, Database Pool, HTTP/Servlet, System/JVM, and others
- Deadlock detection – via
ThreadMXBean.findDeadlockedThreads() - Filtering – by search text, channel, category, and thread state
- Thread dump export – jstack-compatible output, readable by the usual analysers
- Works in both UIs – the same install adds a Thread Viewer tab to the desktop Administrator and the OIE Web Administrator, both served by the same engine-side servlet
- Retained after stop – the last snapshot stays available for browsing and export once monitoring is stopped
- Idle when unused – contention tracking is enabled only while monitoring is running
Access is limited to administrators through OIE’s extension permission system.
Requirements: OIE 4.6.0
Link: https://github.com/gibson9583/engine-thread-viewer
Licensed under the MIT License.